Pulling apart the proposed changes to school grades
12/16/2015
Last week, the state Department of Education released data projecting “simulated” school grades for the 2014-2015 school year, based on what those grades could look like if a series of accountability rule changes under consideration are approved by the State Board of Education in January.
A major source of surprise (and some confusion) about the simulated grades was that, on the whole, the numbers of A, B, C, D, and F schools respectively appeared that they would remain relatively unchanged from the 2013-2014 totals. After several months of superintendents, local school boards, and other advocates on the side of pausing school grades during the transition year (including ourselves) warning about the dire impact of calculating proficiency-only baseline school grades based on the first year of a new, more difficult student test – the news left many wondering what all the fuss had been about.
*******SCROLL DOWN TO FIND YOUR DISTRICT OR SCHOOL IN OUR SIMULATION TOOL*******
One of the reasons for the confusion is that while most of the public discussion has been focused on the potential impact resulting from changes to the students test, there are actually multiple moving parts in the proposed accountability rule changes – some of which have received relatively little public attention.
To help understand the potential impact of each, it is helpful to pull them apart and first look at them each in isolation from the other proposed changes. Among the key individual proposed changes to understand are:
- Proposed passing thresholds (or “cut scores”) that students must meet to be considered performing “at or above grade level” on new student assessments (FSA).
- Proposed changes to the percent of total possible points that a school is required to earn for A, B, C, D & F school grades.
- Proposed revisions to the component sections of what school accountability grades are based on, including temporary exclusion of “learning gains” components for 2014-2015 baseline school grades.
The first of these has received the lion’s share of public input, planning and debate. For those predicting school grades were likely to drop precipitously if released for the 2014-2015 year, those predictions were often based on looking at how results of student test changes would likely impact schools under the existing school accountability grades formula.
But as you can see in our blog post from last week, the school accountability grades thresholds are proposed to actually shift quite a bit. In some ways, this is a needed improvement. As you can see in the image below (and further detailed in our earlier policy brief on school grades), the existing formula includes very narrow windows of point totals for qualifying as a B, C, or D school.

This was an issue that previously had caused significant volatility in year-to-year school grades, as a large enough change in just one component area of the school grades calculation formula could cause a school’s entire overall letter grade to move by one, sometimes two letter grades.
The proposed new thresholds (shown on right in image above) are a significant step towards evening out the “steps” between what is a B, C, or D school – an improvement for stability, fairness and ease of understanding what grades mean. In doing so, however, it’s also important to recognize that most of those thresholds that schools will be evaluated by came down.
So, in effect, projected grades released last week were stabilized by the fact that while the student test would became relatively harder, the point totals that schools have to earn for school grades would become relatively easier. The importance or appropriateness of either is a matter for public debate, but certainly important to understand.
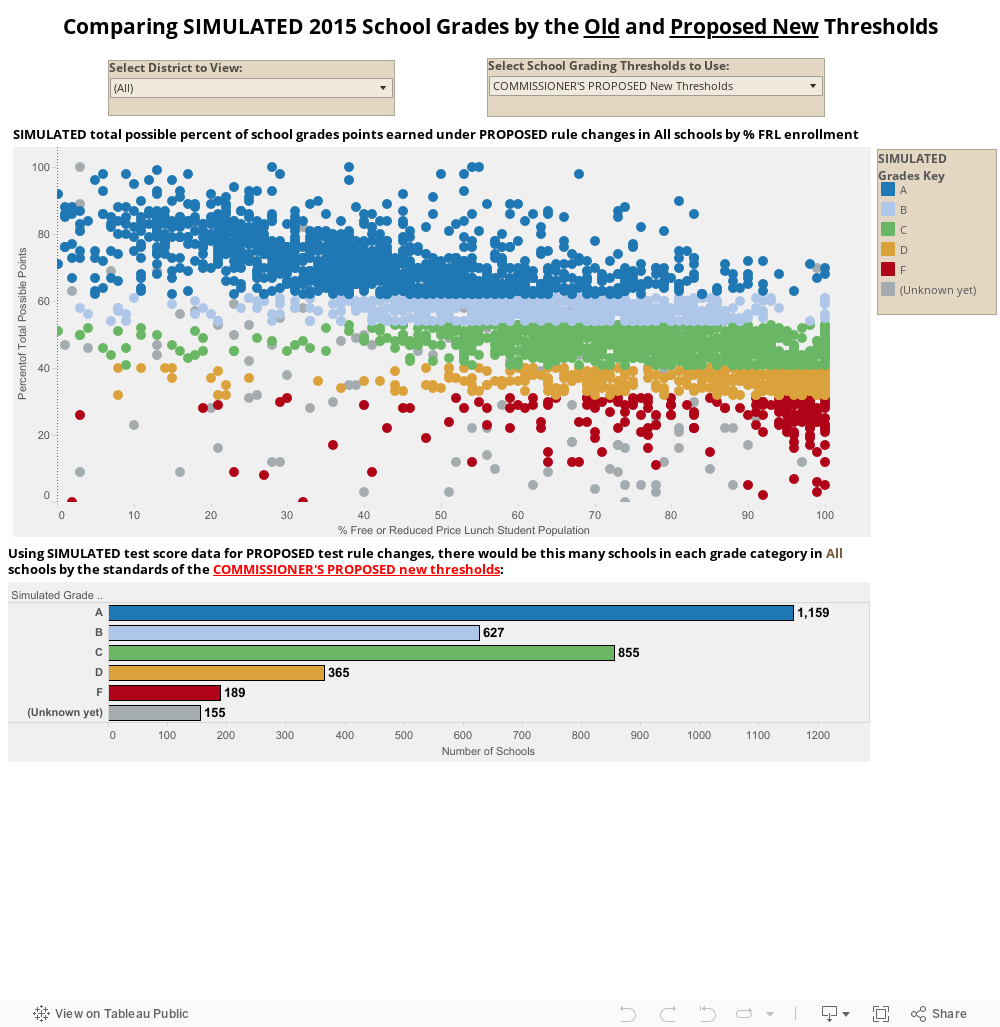
To illustrate the potential impact of the proposed school grade threshold changes, the tool below allows you to see what statewide and district school grade totals would be under the proposed rule changes and under the existing (previous) school accountability grade thresholds (holding constant in each case the assumption that the Commissioner’s proposed student test cut scores are approved).
Use the selection options above the charts below to select your district and then switch back and forth between what the simulated grades would look like under the proposed school grading rules versus the existing ones. Hover your cursor over the dots in the upper graph to find individual schools. As you play around below, let us know what you see or what you think about any of the proposed changes in the comments below.